Introduction
Most organisations collect more data than they can meaningfully use. Transactions, client records, operational logs, documents — it accumulates faster than any analyst team can process it.
The result is predictable: decisions made on incomplete information, reporting cycles that lag reality by weeks, and insight buried in spreadsheets nobody opens.
In regulated Australian sectors, the stakes are higher. Finance and legal organisations need decisions that are not just fast but defensible — traceable outputs that hold up under audit, not instincts dressed as analysis.
AI data analytics addresses this directly. It automates the journey from raw data to actionable intelligence, compressing work that once took days into processes that run continuously. According to ai.gov.au, SME AI adoption reached 44% in February 2026 — up from 43% across the December-February quarter — which signals how quickly this has shifted from experimental to operational.
What follows is a practical breakdown — the six-stage framework for applying AI to your data, a real-world walkthrough, and the architectural decisions that determine whether the system holds up at scale and under scrutiny.
Key Takeaways
- AI data analytics automates pattern detection, prediction, and insight generation at a scale manual analysis cannot match.
- The analytics lifecycle has six stages: define, collect, prepare, analyse, interpret, and act.
- Data preparation takes the most project time — cutting corners here breaks everything downstream.
- For Australian businesses, Privacy Act compliance must be built into data architecture at discovery, not reviewed at go-live.
- Early architecture decisions determine whether the system scales or breaks under new data volumes.
What Is AI Data Analytics?
AI data analytics applies artificial intelligence techniques — machine learning, natural language processing (NLP), and deep learning — to process large volumes of data, identify patterns, and generate insights automatically. Unlike traditional approaches, it does this without manual analyst intervention at every step.
Where traditional analytics requires an analyst to query, clean, and interpret data by hand, AI-driven approaches handle much of that work programmatically, surfacing conclusions at a speed and scale that human review cannot match.
Where It's Applied
The use cases span both internal decision-making and customer-facing operations:
- Financial services — credit risk scoring, fraud detection, transaction monitoring
- Legal practices — contract review, document classification, case prioritisation
- Operations — cost anomaly detection, staffing forecasts, accounts payable modelling
- Marketing — customer behaviour analysis, campaign performance attribution, churn prediction
The Four Analytics Types
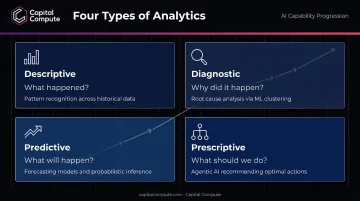
AI can power all four levels of analytics — a meaningful expansion over traditional BI, which typically stops at the first two:
| Type | Question Answered | AI Role |
|---|---|---|
| Descriptive | What happened? | Automates classification and summarisation of historical data |
| Diagnostic | Why did it happen? | ML identifies patterns and relationships in causes |
| Predictive | What will happen? | ML learns from historical data to infer future outcomes |
| Prescriptive | What should we do? | Combines predictions with rules or optimisation to recommend actions |
Why AI Data Analytics Is Critical for Business
Organisations with stronger analytics capabilities consistently outperform peers. McKinsey's analysis found that companies with a higher analytics quotient had more than 2x the revenue growth and 2.5x the five-year total shareholder return of their peers — though this is an observed association, not a controlled causal claim.
At the workflow level, the gains are more concrete. McKinsey also reports that AI-supported credit-memo processes in banking can deliver 20–60% analyst productivity gains and decisions approximately 30% faster.
Core Business Benefits
- Faster time-to-insight — hours of manual analyst work compressed into automated processes that run continuously
- Greater accuracy — AI detects subtle patterns and anomalies that human review misses at scale
- Democratised access — non-technical users query data in plain language, reducing bottlenecks on data teams
- Scalability — handles growing data volumes without proportional headcount growth
- Proactive decision-making — shifts teams from reactive reporting to forward-looking forecasting
- Cost reduction — automating data prep and reporting frees resource for higher-value work
The Regulated Sector Dimension
Those benefits matter even more where regulatory accountability is non-negotiable.
Australian businesses in finance and legal face an additional layer of pressure. AAAPRA's Prudential Standard CPS 230 Operational Risk Management requires regulated entities to maintain oversight of models and third-party systems, validate them independently, and monitor performance continuously.
The OAIC requires a Data Protection Impact Assessment (DPIA) before processing likely to create high risk using AI, with documented lawful basis, data minimisation, and bias assessments.
AI analytics supports compliance here by producing traceable, documented outputs that can be reconstructed and audited at any stage.
How AI Data Analytics Works — Step by Step
The six stages below describe how analytics projects actually run in practice. The most common failures are not technical — they are process failures: vague objectives at stage one, under-prepared data at stage three, and no monitoring loop at stage six.
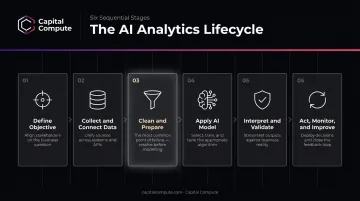
Step 1 — Define the Objective
Before touching data, define the business question precisely. "Which clients are most likely to churn?" or "Where are operational costs spiking?" are workable objectives. "Get more insight from our data" is not.
Vague objectives produce vague outputs and waste engineering effort. This stage requires business stakeholders and technical teams in the same room — misalignment here compounds through every subsequent stage.
Step 2 — Collect and Connect Data
Identify relevant sources — internal databases, CRM systems, billing platforms, third-party APIs — and connect them reliably. Poor schema alignment at this stage breaks everything downstream.
The critical check: are data sources consistent in format, frequency, and completeness? A CRM and a billing system with different client ID formats, for example, will produce join errors that corrupt any model built on top of them.
Step 3 — Clean and Prepare
Remove duplicates, fill or flag missing values, standardise formats, and validate data against known business rules. This stage is where most teams underinvest — and where most analytics projects fail undetected.
According to Anaconda's 2020 State of Data Science survey, practitioners reported spending 45% of their time loading and cleaning data. That proportion does not shrink just because a project uses AI — it shifts to the beginning of the pipeline, where it must be resolved before any model runs.
Step 4 — Apply the AI Model
Select and configure the appropriate method for the objective:
- Regression for numerical forecasting (revenue, cost projections)
- Classification for risk scoring and categorisation (churn likelihood, fraud flags)
- NLP for document review, contract analysis, entity extraction
Architecture choices made at this stage determine scalability. Rushing model selection to reach an output faster is the most expensive mistake in an AI build. Retrofitting architecture after a system goes live under real data volumes costs significantly more than getting it right in sprint one.
Step 5 — Interpret and Validate Results
Validation at this stage covers three distinct checks:
- Compare AI outputs against known benchmarks to confirm directional accuracy
- Flag unexpected patterns or model bias before results reach decision-makers
- Translate outputs into human-readable insight that non-technical stakeholders can act on
AI outputs are a starting point for judgement — not a replacement for it. The SRA's guidance on AI in legal practice is unambiguous: professional accountability remains with the regulated firm, not the model.
Step 6 — Act, Monitor, and Improve
Use validated insights to make decisions, then track outcomes against predictions. AI analytics is not a one-time deployment — it is a continuously improving system.
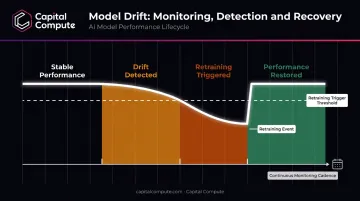
Teams that skip monitoring experience model drift: as real-world data distributions shift from what the model was trained on, accuracy degrades silently. How often you monitor should match how frequently new data arrives and how consequential each decision is. Retraining should trigger when drift is detected or when measured performance falls below an agreed threshold.
AI Data Analytics in Practice — A Real-World Walkthrough
The six stages above are not abstract. Here is how they play out in a realistic Australian business context: a financial services firm trying to reduce client churn.
The Scenario
The firm notices revenue is declining. Clients are leaving, but the pattern is only visible in retrospect — by the time a client churns, the opportunity to intervene has passed. The objective: build a system that identifies high-risk accounts before they leave.
Stage 1 — Define the objective: The team agrees the question is "Which clients show early behavioural signals of churn risk?" — not "Tell us about client behaviour generally." This distinction forces specificity in what data is collected and what the model needs to output.
Stage 2 — Collect and connect: Client activity data is pulled from the CRM and billing system. Both sources exist, but they use different client identifiers. This is identified and resolved at pipeline design, not mid-sprint.
Stage 3 — Clean and join: The merged dataset contains duplicates from CRM migration, missing contract end dates for approximately 12% of records, and billing entries with null values. These are addressed before any model runs. Assuming the CRM is clean is the most common mistake at this stage.
Stage 4 — Apply the model: A classification model is trained to score each client's churn probability based on login frequency, support ticket volume, billing payment timing, and contract tenure. The first model output is validated against a holdout test set — not treated as final.
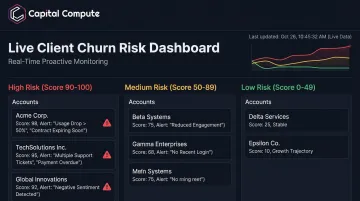
Stage 5 — Interpret risk tiers: Clients are grouped into high, medium, and low risk. The model's outputs are reviewed by account managers who understand context the model cannot — recent relationship events, renewal conversations, referrals in progress.
Stage 6 — Act and monitor: Instead of a static monthly churn report, account managers now have a live risk dashboard. High-risk clients trigger outreach within the same working week. Model performance is reviewed monthly, with retraining triggered when accuracy metrics drop below threshold.
What This Changes
Every stage in the walkthrough above shifts the firm's posture from reactive reporting to proactive intervention — and that shift is where the measurable value lives. HSBC's AI-driven transaction monitoring system — built on a similar detect-and-act architecture — processes approximately 980 million transactions per month, identifying 2–4x more financial crime while producing 60% fewer false-positive cases compared to the prior rules-based approach.
The scale is different. The architecture logic is not.
This six-stage process is not tied to a specific technology stack. It applies whether a team builds its own system or works with a development partner. What determines whether the system stays useful at scale comes down to two things:
- Data architecture decisions made at stages two and three — not revisited after problems appear
- Model governance locked in at stage four — so performance can be tracked and improved over time
The tooling matters far less than when those decisions get made.
How Capital Compute Can Help
Capital Compute is an Australian-based custom software and AI development firm that builds bespoke AI data analytics systems for businesses in finance, legal, and marketing. The team operates as an engineering partner, not a software vendor — no licences, no off-the-shelf tools. Clients receive a system built to their specific data architecture, compliance requirements, and scalability needs, with full code ownership on delivery.
Several of Capital Compute's delivery principles address the points where analytics projects most commonly fail:
- APP-compliant data architecture scoped at discovery — compliance obligations, lawful basis mapping, data minimisation, and audit trail requirements are defined before a line of code is written, not reviewed at go-live
- Senior engineer involvement from sprint one — architecture decisions that determine long-term scalability are made by senior engineers at the outset, not delegated and revised after scale events occur
- Fixed-price milestone gates — clients review and approve outputs before each phase begins, which eliminates cost overruns from scope drift
- Production AI agents already shipped in legal, finance, and marketing — the team has delivered working AI systems in the regulated sectors where analytics complexity and governance requirements are highest
The month-to-month retainer model means ongoing monitoring, drift detection, and model refinement — Step 6 of the analytics lifecycle — can be handled without a long-term contract. After handover, clients retain full control and institutional knowledge of their system, with no ongoing dependency on Capital Compute to keep it running.
Conclusion
AI data analytics works as a process discipline, not a procurement checklist. The six-stage framework holds regardless of sector, data size, or technical maturity: define clearly, prepare thoroughly, build architecture that scales, interpret outputs with judgement, and close the loop between insight and action.
For Australian businesses in regulated industries, one principle sits above the rest: Privacy Act compliance and auditability must be built into the analytics architecture from sprint one. A system retrofitted for compliance after go-live carries regulatory risk. One designed for it from discovery does not.
That decision gets made in discovery. Not at go-live, and not under pressure from an audit. Getting the architecture right at the start is what separates analytics systems that compound value over time from those that stall at the first compliance review.
Frequently Asked Questions
How is AI used in data analytics?
AI automates the most time-intensive parts of the analytics workflow — data cleaning, pattern detection, and insight generation — using machine learning, NLP, and predictive modelling. Teams move from raw data to actionable decisions far faster than manual methods allow, with models running continuously rather than on reporting cycles.
Which AI tool is best for data analytics?
It depends on the use case. Off-the-shelf BI platforms work for internal reporting, but businesses embedding analytics into products or regulated workflows often need bespoke systems built to their specific data architecture, compliance requirements, and scalability needs — no single tool fits all contexts.
Will AI replace data analysts?
AI shifts analyst work away from repetitive data preparation and report generation toward higher-value tasks: model validation, business interpretation, and strategic recommendation. The WEF's 2025 Future of Jobs Report found that analytical thinking remains the most requested core skill — analysts become more effective, not redundant.
What are the biggest risks of implementing AI data analytics?
The three main risk categories are poor data quality, model bias from unrepresentative training data, and regulatory non-compliance. Australian businesses handling personal data must conduct a DPIA before high-risk AI processing and document lawful basis and bias assessments under the Privacy Act.
How long does it take to build an AI data analytics system?
A focused, well-scoped system — such as a churn prediction model or financial risk dashboard — typically reaches a working prototype within 6–10 weeks when data pipelines are clean and objectives are clearly defined. The biggest determinant of delivery speed is the quality of scoping in sprint one, not the complexity of the AI itself.